After running a simulation, results are available immediately—you don't need to add plotters or configure separate output views. ReliaSim surfaces results at three levels: system-wide indicators on the top bar, per-node results directly on node popups, and compiled analysis through the left navigation bar.
System-Wide Performance
The Efficiency Gauge and Production Throughput on the Top Navigation Bar update as soon as a simulation completes. These give you an at-a-glance summary of how the overall system performed under the current parameter set and experiment settings.
For more detail on these indicators and the Replay feature, see Top Navigation Bar.
Per-Node Results
Every node in your model has results available directly on its popup. Click any node after a run to open its properties, and you'll see a Results panel on the right-hand side showing key metrics for that specific node—such as throughput, internal availability, and the number of internal down events.
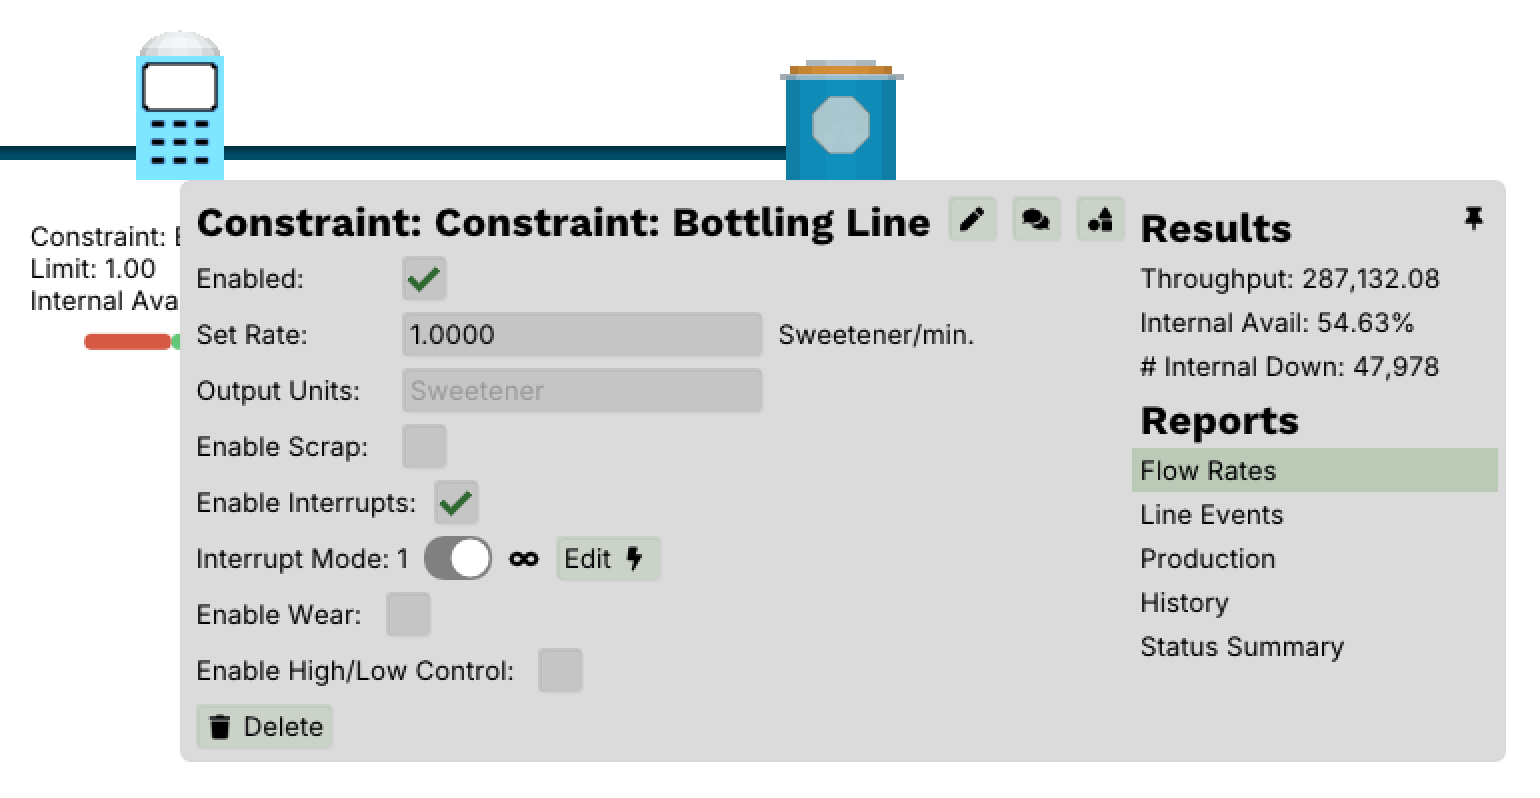
Below the summary metrics, a Reports section lists detailed report views available for that node:
- Flow Rates — how material moved through the node over time
- Line Events — individual up/down events and their durations
- Production — cumulative output over the simulation window
- History — a time-series record of the node's state changes
- Status Summary — a high-level breakdown of time spent in each state
These reports vary by node type—a buffer will show different metrics than a constraint—but the pattern is the same: click the node, and its results are right there. No additional setup is required.
Analysis Editor
The Analysis icon in the Left Navigation Bar opens a compiled view of results across the entire model for the current experiment and parameter set. While per-node popups show results for individual nodes, the Analysis editor brings everything together in one place for comparison and review.
Where to Look First
When reviewing a completed simulation:
- Start with the top bar — check efficiency and throughput for a quick health check
- Click individual nodes — inspect the results and reports on any node that looks like a bottleneck or underperformer
- Open Analysis — compare results across nodes to identify system-wide patterns
- Use Replay — if results are unexpected, step through the simulation timeline to see why (see Top Navigation Bar)