ChiAha
  • ReliaSim Overview
    • Getting Started
    • Navigation
    • Structure
      • Node Types
        • Buffers
        • Constraints
          • Limits
          • Interrupts
            • Interrupt Types
            • Time to Failure
            • Time to Repair
            • Distributions
              • Fixed Distribution
              • Uniform Distribution
              • Normal Distribution
              • Weibull Distribution
              • LogNormal Distribution
              • Johnson SU Distribution
        • Splits
        • Merges
        • Conveyors
        • Conversions
    • Experiments
      • Experiment Types
      • Experiment Parameters
    • Reports
      • OEE
      • Single Run Results
      • Multi-Run Results
      • Buffer Trade-off Results
      • Interrupt Loss/Gain Results
  • ChiAha Discrete Rate Simulation
    • Example
    • References
  • Building your first model
    • Structure
    • Node View
    • Conversions
    • Interrupts
    • Experiments and Reporting
    • Saving your model
  • Another Example Model
    • Basic Structure
    • Conversions
    • Splits and Merges
    • Full Structure
    • Node View
      • Units and Conversions
      • Rates and Buffers
    • Interrupts
    • Experiments
      • Single Run
      • Interrupt Loss/Gain
      • Buffer Tradeoff
    • Summary
  • Wishbone Overview
    • Video Overview
    • Loading a File
    • Excluding Cause Groups
    • Mapping Cause Groups
    • Reviewing Estimates
  • Model Building with Markdown
    • The Click-Connect System
Powered by GitBook
On this page

Was this helpful?

  1. Wishbone Overview

Loading a File

PreviousVideo OverviewNextExcluding Cause Groups

Last updated 2 months ago

Was this helpful?

Included below is a sample tape created using ReliaSim that we will use to demonstrate and test out Wishbone. It is a simple tape with 4 interrupts on a single constraint that was simulated for 1000 hours.

After opening Wishbone and selecting this file, you must specify 3 pieces of information:

  • Which column represents the start time of an event?

  • Which column represents the downtime? This would be downtime duration, if using duration or end time of an event, if using end time.

  • Which additional columns would you like to include? These will be useful for establishing cause groups.

For our example, the settings will look like this:
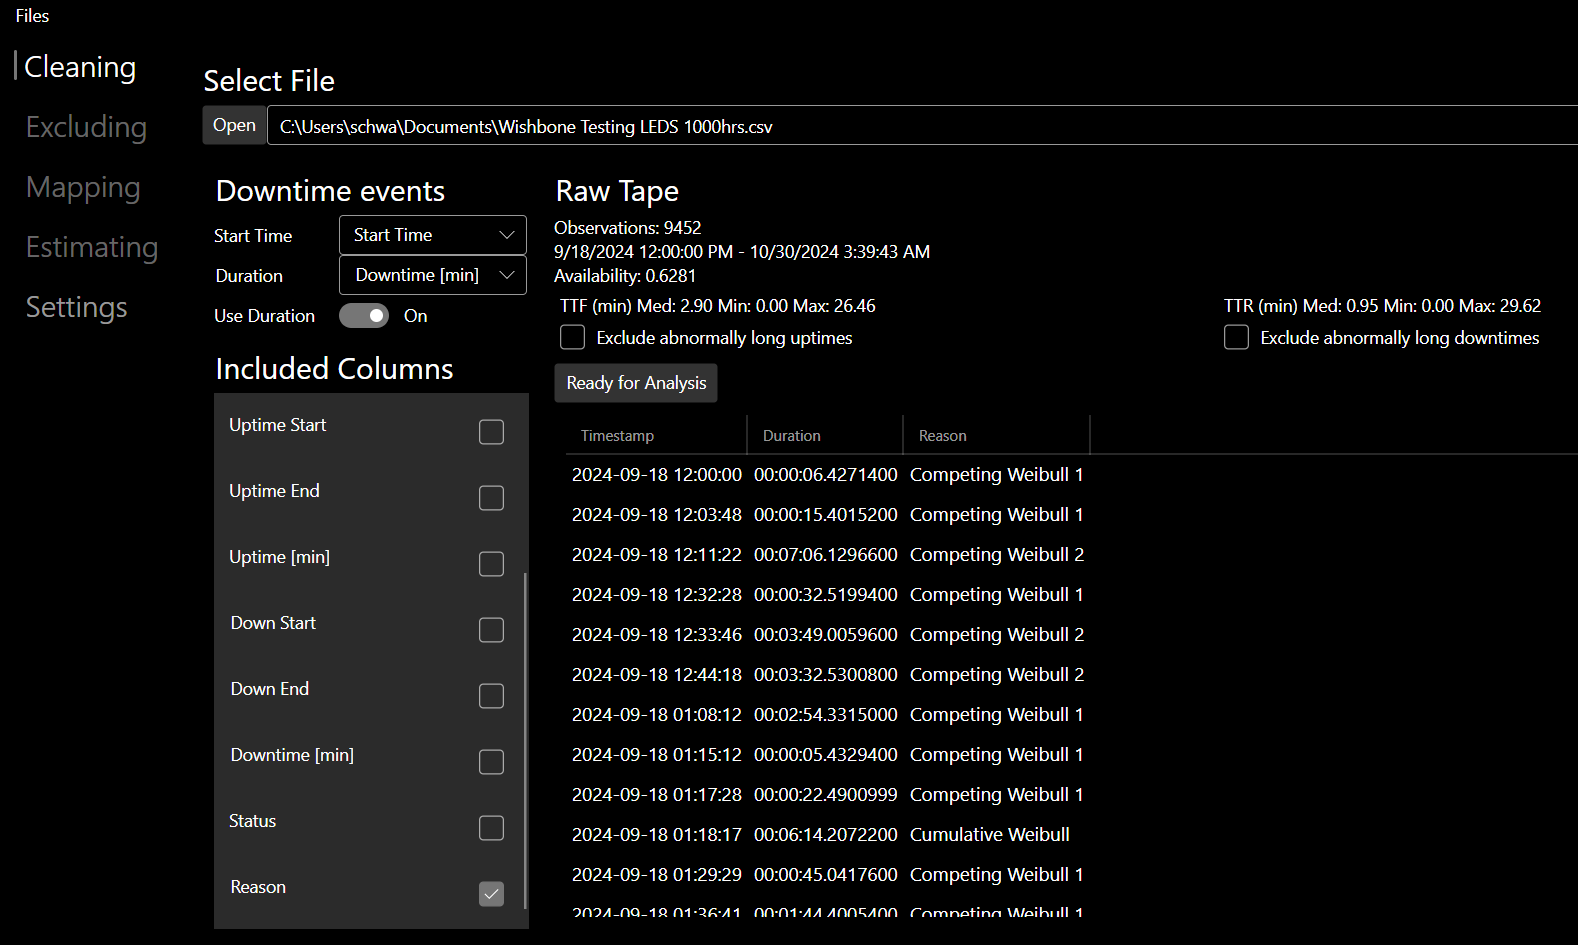
Once you have selected the relevant columns, click the "Ready for Analysis" button to unlock the Excluding and Mapping tabs.

2MB
Wishbone Testing LEDS 1000hrs.csv
File Load Settings